MOVE 150,200 MOVE 400,300 PLOT 85,500,150

This section draws together the information about graphics facilities and colours given under various keywords. Although it repeats much of the information presented elsewhere in this manual it provides a consolidated explanation of the graphics facilities and colours available.
In these cases you should always select an explicit window size. You can do that using the MODE statement, or by selecting a user-defined mode with VDU 23,22.... In BBC BASIC text rows are counted from the top of the window and graphics coordinates are measured from the bottom of the window, so selecting a display mode with known dimensions is particularly important to ensure consistent alignment of text and graphics. When a MODE statement is executed the window dimensions are changed to those appropriate to that mode, with (initially) white text on a black background. The 'screen' (BASIC's output window) is cleared and all the graphics and text parameters (colours, origin, etc) are reset to their default values.
A good general-purpose mode is MODE 8 which has 80 columns by 32 rows of text, and graphics dimensions of 640 pixels by 512 pixels (1280 x 1024 graphics units). This mode is small enough to fit easily within the desktop area on the majority of PCs. You can select MODE 8 as follows:
If you prefer black text on a white background a mode of the same size can be selected as follows:MODE 8
Don't be tempted to use a MODE whose nominal dimensions are the same as your display resolution; by the time you've made allowances for the window's title bar and borders, and the task bar, it won't fit! So if your display is set to a resolution of 1024 x 768 don't use a MODE bigger than about 800 x 600 pixels (e.g. MODE 20). If you (exceptionally) want to use the entire screen you can either maximise the window or operate in full screen mode. You should not attempt to achieve the same effect by choosing a MODE larger than will fit.VDU 23,22,640;512;8,16,16,128
This table indicates the number of logical colours available in each display mode. As described in The Palette sub-section, the number of physical colours available depends upon the display settings.
Mode Text (chars) Graphics (pixels) Graphics units Logical Colours 0 80x32 640x512 1280x1024 2 1 40x32 640x512 1280x1024 4 2 20x32 640x512 1280x1024 16 3 80x25 640x500 1280x1000 16 4 40x32 640x512 1280x1024 2 5 20x32 640x512 1280x1024 4 6 40x25 640x500 1280x1000 16 7 40x25 teletext teletext 8 8 80x32 640x512 1280x1024 16 9 40x32 640x512 1280x1024 16 10 90x36 720x576 1440x1152 16 11 45x36 720x576 1440x1152 16 12 120x48 960x768 1920x1536 16 13 60x48 960x768 1920x1536 16 14 160x64 1280x1024 2560x2048 16 15 80x64 1280x1024 2560x2048 16 16 80x25 640x400 1280x800 16 17 40x25 640x400 1280x800 16 18 80x30 640x480 1280x960 16 19 40x30 640x480 1280x960 16 20 100x30 800x600 1600x1200 16 21 50x30 800x600 1600x1200 16 22 128x48 1024x768 2048x1536 16 23 64x48 1024x768 2048x1536 16 24 144x54 1152x864 2304x1728 16 25 72x54 1152x864 2304x1728 16 26 160x60 1280x960 2560x1920 16 27 80x60 1280x960 2560x1920 16 28 180x54 1440x1080 2880x2160 16 29 90x54 1440x1080 2880x2160 16 30 200x75 1600x1200 3200x2400 16 31 100x75 1600x1200 3200x2400 16 32 80x25 640x400 1280x800 2 33 40x25 640x400 1280x800 4
With 'paletted' displays (256 colours or fewer) the number of logical colours represents the maximum number of different colours that can be displayed in the BBC BASIC window at any one time. Palette animation is possible: changing the contents of the palette affects colours previously plotted.
With 'non-paletted' displays (32768 colours or more) the number of colours which can be shown at any one time is limited only by the display settings. Changing the contents of the palette affects only colours subsequently plotted.
The command *EGA ON automatically maps mode numbers 0 to 7 to EGA-compatible modes in the same way as it does with BBC BASIC (86).
The command *EGA OFF automatically maps mode numbers 0 to 7 to CGA-compatible modes, as used by BBC BASIC (86) for MS-DOS. When converting a BBC BASIC (86) graphics program add a *EGA OFF command at the beginning.
As well as these predefined MODEs, you can also select a 'custom' mode using VDU 23,22.
Initially, and after a MODE change, the colour numbers refer to default colours which depend on the mode, as follows:
Foreground Background Colour 0 128 Black 1 129 White
Foreground Background Colour 0 128 Black 1 129 Magenta 2 130 Green 3 131 White
However you can (with certain limitations) set the actual colour displayed by these colour numbers to any one of the physical colours available, using the VDU 19 command or a variant of the COLOUR statement.
Foreground Background Colour 0 128 Black 1 129 Red 2 130 Green 3 131 Yellow 4 132 Blue 5 133 Magenta 6 134 Cyan 7 135 White 8 136 Intensified Black (Grey) 9 137 Intensified Red 10 138 Intensified Green 11 139 Intensified Yellow 12 140 Intensified Blue 13 141 Intensified Magenta 14 142 Intensified Cyan 15 143 Intensified White
Because you can change the actual colour displayed by a colour number to any one of the physical colours available to you, these numbers are called logical colours. You could, if you wished, set all the logical colour numbers to the same physical colour.
It may help you to visualise the logical colours as an artist's palette with up to 16 numbered areas where colours may be placed. You could place any of the colours available to you in any one of the areas on the palette. Once the colours were in place on the palette, you could 'paint by numbers'.
To select a logical colour to one of these physical colours you use either the VDU 19 command or the COLOUR statement:
Colour Number Physical Colour 0 Black (normal background) 1 Red 2 Green 3 Yellow 4 Blue 5 Magenta (blue-red) 6 Cyan (blue-green) 7 White (normal foreground) 8 Intensified Black (grey) 9 Intensified Red 10 Intensified Green 11 Intensified Yellow 12 Intensified Blue 13 Intensified Magenta 14 Intensified Cyan 15 Intensified White
VDU 19,logical,physical,0,0,0
COLOUR logical,physical
To select a logical colour to one of these physical colours you must use the VDU 19 command:
This mode is provided for compatibility with BBC BASIC (86).VDU 19,logical,-1,red,green,blue
To select a logical colour to one of these physical colours you use either the VDU 19 command or the COLOUR statement:
VDU 19,logical,16,Red,Green,Blue
COLOUR logical,Red,Green,Blue
If the colour number is less than 128, the colour of the text is set to that value. If the number is 128 or greater, the colour of the text background is set to the value minus 128.COLOUR colour
The GCOL command also (optionally) specifies how the colour is to be plotted on the screen. It can be plotted directly, ANDed, ORed or Exclusive-ORed with the colour already there, or the existing colour can be inverted. If the plotting mode is omitted, it defaults to zero (plot):
If the colour number is less than 128, the graphics colour is set to that value. If the number is 128 or greater, the colour of the graphics background is set to the value minus 128. Generally, you will not notice a change in the graphics background colour until you clear the graphics screen with a CLG statement.GCOL colour GCOL mode,colour
The plotting modes are as follows:
See the Compatibility limitations section for important notes on the use of these plotting modes.
mode=0 Plot the colour specified. mode=1 OR the specified colour with the colour that is already there. mode=2 AND the specified colour with the colour that is already there. mode=3 Exclusive-OR the specified colour with the colour that is already there. mode=4 Invert the colour that is already there.
By default, the graphics viewport is the full size of BASIC's output window and the graphics origin is at the bottom left-hand corner of that window. You may change the size of the graphics viewport with the VDU 24 command and the graphics origin with the VDU 29 command or ORIGIN statement. The action of these commands is described later in the Text and graphics viewports sub-section.
You can move or draw to any point, whether or not this point is outside the current graphics viewport. If you draw a line to a point outside the graphics viewport, the line is not displayed beyond the boundary of the viewport.
The start of the line is the current graphics cursor position. This is either the end of the last line drawn or a point specified by a previous MOVE or PLOT statement.
The line is drawn in the current graphics foreground colour. This colour can be changed using the GCOL statement.
The DRAW statement is identical to PLOT 5.DRAW x,y MOVE 200,300 DRAW 640,800
Alternatively you can draw a straight line by specifying both ends:
LINE x1,y1,x2,y2
LINE 200,300,640,800
The MOVE statement is identical to PLOT 4.MOVE X,Y MOVE 124,327
As previously described, the two most commonly used statements, PLOT 4 and PLOT 5, have the duplicate keywords MOVE and DRAW. The keywords CIRCLE, ELLIPSE, FILL, LINE and RECTANGLE also duplicate certain of the PLOT commands.PLOT mode,X,Y
The available PLOT modes are as follows:
Mode Action 0-7 Basic line drawing modes. 8-63 Enhanced line drawing modes. 64-71 Plot a single point. 72-79 Horizontal line fill to non-background. 80-87 Plot and fill a triangle. 88-95 Horizontal line fill to background right. 96-103 Plot and fill an axis-aligned rectangle. 104-111 Horizontal line fill to foreground. 112-119 Plot and fill a parallelogram. 120-127 Horizontal line fill to non-foreground right. 128-135 Flood-fill to non-background. 136-143 Flood-fill to foreground. 144-151 Draw a circle. 152-159 Plot and fill a disc. 160-167 Draw a circular arc. 168-175 Plot and fill a segment. 176-183 Plot and fill a sector. 185/189 Move a rectangular block. 187/191 Copy a rectangular block. 192-199 Draw an outline axis-aligned ellipse. 200-207 Plot and fill a solid axis-aligned ellipse. 249/253 Swap a rectangular block.
Lines are drawn from the current graphics cursor position (the last point 'visited') to the specified X,Y coordinates. The coordinates must be in the range −32768 to +32767.
Mode Action 0 Move relative to the last point. 1 Draw a line, in the current graphics foreground colour, relative to the last point. 2 Draw a line, in the logical inverse colour, relative to the last point. 3 Draw a line, in the current graphics background colour, relative to the last point. 4 Move to the absolute position. 5 Draw a line, in the current graphics foreground colour, to the absolute coordinates specified by X and Y. 6 Draw a line, in the logical inverse colour, to the absolute coordinates specified by X and Y. 7 Draw a line, in the current graphics background colour, to the absolute coordinates specified by X and Y.
There may seem little point in omitting the last point (modes 8-15) but this can be useful in 'inverse' or 'exclusive-or' plotting modes. For example, when drawing a polygon in an 'exclusive-or' mode this can ensure that each vertex is correctly plotted.
Mode Action 8-15 As 0-7, except that the last point is omitted. 16-31 As 0-15, but the line is drawn dotted. 32-47 As 0-15, but the line is drawn dashed. 48-63 As 0-15, but the line is drawn broken.
Note that in BBC BASIC for Windows dotted, dashed and broken lines can only be drawn at the (default) thickness of one pixel. If you increase the thickness using VDU 23,23 lines are always drawn continuous. This limitation does not apply to BBC BASIC for SDL 2.0.
If you want to plot a single pixel you can use:
MOVE X,Y:DRAW X,Y or
LINE X,Y,X,Y
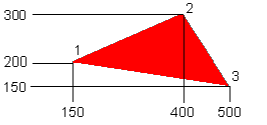
The following example plots and fills the triangle illustrated in the current graphics foreground colour.
MOVE 150,200 MOVE 400,300 PLOT 85,500,150 |
 |
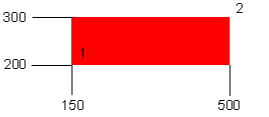
The following example plots and fills the rectangle illustrated in the current graphics foreground colour.
MOVE 150,200 PLOT 101,500,300 |
 |
See also the RECTANGLE FILL statement.
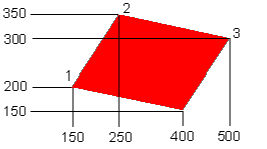
The order in which the points are visited is important.point3-point2+point1
The following example plots and fills the parallelogram illustrated in the current graphics foreground colour.
MOVE 150,200 MOVE 250,350 PLOT 117,500,300 |
|
In BBC BASIC for SDL 2.0 a substantial speed improvement may be achievable by first defining a graphics viewport which only just encloses the area to be filled.
See also the FILL statement.
In BBC BASIC for SDL 2.0 a substantial speed improvement may be achievable by first defining a graphics viewport which only just encloses the area to be filled.
will draw a circle centred on x1,y1 with the point x2,y2 in its circumference. If the 'relative' plot codes (144 to 147) are used either of the parameters may be used to specify the radius. For example, eitherMOVE x1,y1 PLOT 149,x2,y2
orMOVE x,y PLOT 145,R,0
will draw a circle of radius R centred about the point x,y.MOVE x,y PLOT 145,0,R
See also the CIRCLE statement.
If plot codes 156 to 159 are used, the point specified will be on the circumference of the disc. If plot codes 152 to 155 are used, the non-zero parameter is interpreted as the radius of the disc.
See also the CIRCLE FILL statement.
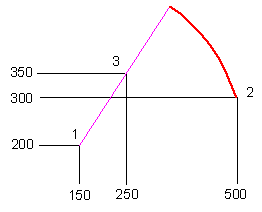
The following example draws the arc illustrated in the current graphics foreground colour:
MOVE 150,200 MOVE 500,300 PLOT 165,250,350 |
 |
The following example draws the segment illustrated in the current graphics foreground colour:
MOVE 150,200 MOVE 500,300 PLOT 173,250,350 |
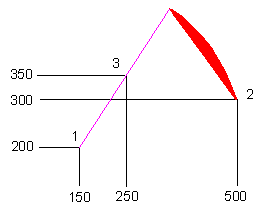 |
The following example draws the sector illustrated in the current graphics foreground colour:
MOVE 150,200 MOVE 500,300 PLOT 181,250,350 |
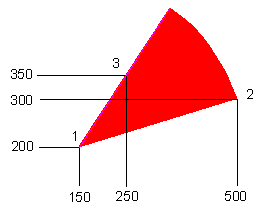 |
See also the RECTANGLE FILL ... TO statement.
See also the RECTANGLE ... TO statement.
See also the RECTANGLE SWAP ... TO statement.
The following example draws the ellipse illustrated in the current graphics foreground colour:
MOVE 250,200 MOVE 500,300 PLOT 197,150,350 |
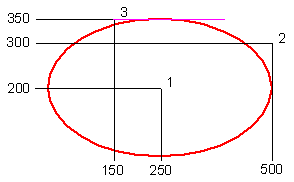 |
See also the ELLIPSE statement.
The following example draws the filled ellipse illustrated in the current graphics foreground colour:
MOVE 250,200 MOVE 500,300 PLOT 205,150,350 |
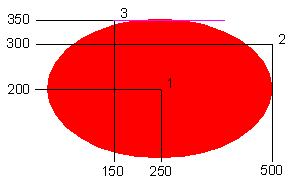 |
See also the ELLIPSE FILL statement.
would draw a line in the current graphics foreground colour from 200, 300 to 200,450.PLOT 1,0,150
Logical Inverse 0 1 1 0
Logical Inverse 0 3 1 2 2 1 3 0
Logical Inverse 0 15 1 14 2 13 3 12 etc. 12 3 13 2 14 1 15 0
There must not be a space between POINT and the opening bracket.
If two or more palette entries have the same (or nearly the same) physical colour, POINT may not return the expected value.
You can use POINT to find out the colour of the screen at the specified point and take action accordingly. In an adventure game, for example, the swamps may be marked in green. If the explorer ventured into a green area he must be in the swamp and 'swamp type demons' would be activated.colour=POINT(X,Y) IF POINT(X,Y)=3 THEN 300
See also the TINT function.
BBC BASIC writes text to the text viewport and graphics to the graphics viewport. The text and graphics viewports can overlap. By default, the text and graphics viewports are the full size of BASIC's output window, but their size and position may be changed.
The text and graphics viewports may be restored to their default state with the VDU 26 command (but see the important note there).
The CLS command clears the text viewport to the current text background colour. The CLG command clears the graphics viewport to the current graphics background colour with the current graphics background plotting action (set by GCOL). If the text and graphics viewports overlap, the background colour of the overlapping area will be set by the last clear command issued.
If the text cursor is outside the new viewport, it is moved to the new home position (top left of the viewport). If it is inside the new viewport, it is not moved.
The following example defines a text viewport with the bottom left corner at 0,15 (X across, Y down) and the top right corner at 30,3 (X across, Y down).
VDU 28,0,15,30,3
It is particularly easy to select invalid viewport limits if the graphics origin has been moved. It is advisable, therefore, to precede a VDU 24 command with a VDU 29,0;0; or ORIGIN 0,0 command to reset the graphics origin.
The following example defines a graphics viewport with the bottom left corner at 200,100 (X,Y) and the top right corner at 500,300 (X,Y).
Note the use of semicolons in this VDU command; their significance is explained under VDU in the keywords section. In particular, be very careful not to omit the final semicolon.VDU 24,200;100;500;300;
The following statements both set the graphics origin to X=640, Y=400:
Note the use of semicolons in the VDU command. Their significance is explained under VDU in the keywords section.ORIGIN 640,400 VDU 29,640;400;
will print the word 'Fred' starting at column 15 of row 10. The top left hand corner of the text viewport is 0,0.PRINT TAB(10,15)"Fred"
When printing characters at the graphics cursor position, the top left-hand corner of the character cell is positioned at the graphics cursor position.
The characters are 'opaque' and they can be positioned only at text coordinates within the text viewport. The text within the viewport scrolls as necessary.
The characters have a 'transparent' background and they are plotted according to the current foreground GCOL rules and colour. VDU 127 (DEL) is an exception; it backspaces and deletes just as it does in the normal text mode using the current background GCOL colour and action.
In the graphics modes, characters may be positioned at any graphics coordinate within the graphics viewport. The top left of the character cell is the reference point. Characters are clipped to the limits of the graphics viewport if necessary. No scrolling takes place.
Note that selecting a proportional spaced font may affect the operation of certain features, such as INPUT editing, positioning of text using TAB(X) and reading the current character with GET(X,Y).*FONT Courier New,16
A%=&87
char=(USR(&FFF4) AND &FF00) DIV 256
In order to use the OSWORD call, you need to define a 9 byte area of memory in which the character code is passed and the dot pattern is returned. As with the BBC Micro, the OSWORD function number is passed in A% and the address of the parameter block is passed in X% and Y%. The least significant byte is passed in X% and the most significant in Y%
The following program segment:
The character dot pattern is returned in the 8 bytes 'pattern?1' to 'pattern?8'.DIM pattern 8 ?pattern=character A%=&A X%=pattern MOD 256:Y%=pattern DIV 256 CALL &FFF1
In earlier versions of BBC BASIC, the size and shape of the physical pixels varied with the selected screen mode. For example in MODE 1 the pixels were twice as wide as in MODE 0. This does not apply in the case of BBC BASIC for Windows or BBC BASIC for SDL 2.0: the size of the physical pixels is determined solely by the current screen resolution. Although changing BASIC's screen mode can affect the size of text characters, and the maximum number of colours available, the pixels remain the same size: one pixel always corresponds to two BASIC graphics units. For example, MODEs 0, 1 and 2 are all 640 pixels wide by 512 pixels high, or 1280 graphics units wide by 1024 graphics units high.
An attempt could have been made to emulate more closely (in software) the detailed characteristics of the BBC Microcomputer and Acorn Archimedes screens. However this would have adversely affected performance and made it difficult to mix the use of BASIC graphics statements with native Windows™ or SDL 2.0 API functions. Instead, the graphics statements are mapped to API functions in the most straightforward way, consistent with a reasonable degree of compatibility.
When these small differences matter, the following sections describe in detail how BBC BASIC for Windows and BBC BASIC for SDL 2.0 behave, and therefore makes it possible to write programs which have precisely the desired effect on the screen. Alternatively you may want to consider using the anti-aliased graphics functions in the GDIPLIB and aagfxlib libraries respectively.
Whereas on earlier versions of BBC BASIC the thickness of a line may vary depending on the screen MODE in use, this is not the case with BBC BASIC for Windows and BBC BASIC for SDL 2.0 where it will always be (by default) one pixel thick. If you need to draw a thicker line you can use VDU 23,23.
For example, if plotting a rectangle with:
the point 100,300 (the top-left corner) will be inside the rectangle but 300,100 (the bottom-right corner) will be outside the rectangle. Put another way, the width and height of the rectangle will both be 200 graphics units (100 pixels) with the bottom-left corner of the rectangle at coordinates 100,102 (not 100,100). This behaviour is independent of the order in which the vertices are specified, therefore the position and size of the rectangle will be same for all the following methods:MOVE 100,300 : PLOT 101,300,100
The above does not apply to BBC BASIC for SDL 2.0 in which solid shapes should be drawn inclusive of all the vertex coordinates, which is more standard for BBC BASIC.MOVE 300,300 : PLOT 101,100,100 MOVE 100,100 : PLOT 97,200,200 RECTANGLE FILL 100,100,200,200
If you need to plot a single (hardware) pixel, you can do that by drawing a 'line' of zero length:
orMOVE X,Y : DRAW X,Y
LINE X,Y,X,Y
There are two main respects in which compatibility may be impacted. Firstly, many early BBC BASIC programs (e.g. for the BBC Micro) used 'palette animation', in which the colour of every pixel with a specific 'colour number' can be changed instantaneously by modifying the contents of the palette using VDU 19; true colour (RGB) displays do not provide a comparable facility. Secondly, the 'logical' plotting operations (OR, AND, exclusive-OR and invert, as selected by GCOL) can behave in a way different from that which you might expect. Whilst it may sometimes be possible to configure your screen to emulate a 'paletted' or 'indexed' display, it may still not be fully compatible and performance may suffer.
In 'true color' modes there is no physical palette; the screen memory holds the RGB (Red, Green, Blue) colour directly. BBC BASIC still uses a 'logical' palette of 16 colours, but this is purely for software convenience and to maximise compatibility between paletted and non-paletted displays. The actual number of colours which can be displayed in BASIC's output window at any one time is limited only by the display settings. Changing the contents of BASIC's palette affects only things subsequently plotted; the existing screen contents are unaffected.
In these modes the 'logical' plotting operations (OR, AND etc.) operate on the physical RGB colour, not on the logical colour. Suppose you have selected (using VDU 19 or COLOUR) colour 1 to be red, colour 2 to be green and colour 3 to be blue. If you firstly use GCOL 0,1 to plot in red, then use GCOL 1,2 to combine the existing colour with colour 2 using the OR plotting mode, you would expect the end result to be colour 3 (1 OR 2) i.e. blue. However, what will actually happen is that the RGB value for red will be logically ORed with the RGB value for green, resulting in yellow, not blue.
|
CONTINUE
|